This section describes the installation maintenance features of Intershop
System Management including the generation of reports and dump files.
Accessing and Navigating the Monitoring Module
To access the monitoring module:
Select Monitoring from the Intershop System Management navigation bar.
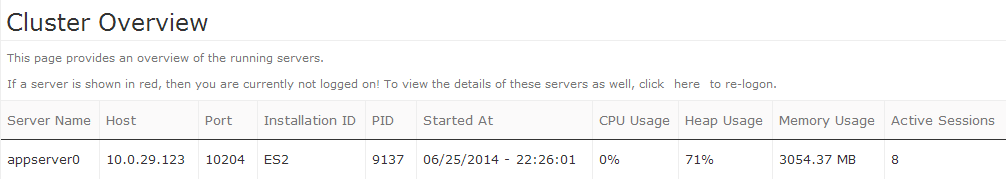
This opens the Cluster Overview page, which lists all servers in the cluster and displays basic performance data.Figure 1. Cluster overview page
Monitoring Sub-Modules
The Monitoring section in the navigation bar comprises the following sub-modules, each providing the corresponding detailed information:
Application Server
Java VM
OR Mapping
JDBC
Cartridges
Performance
Background
Database Status
Locking
Services
Sub-Module Overview Page
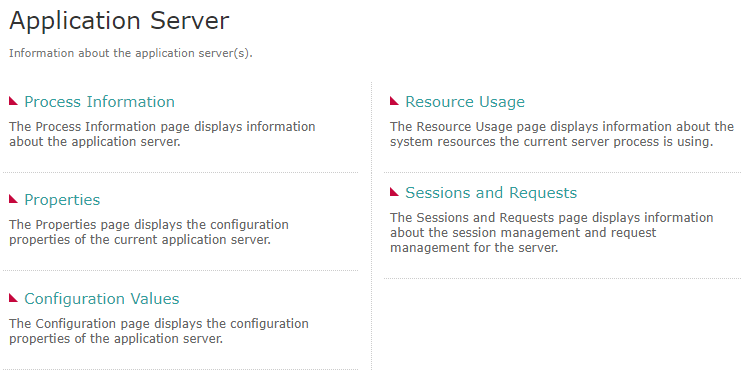
By clicking one of the sub-modules, you are taken to an overview page that lists the available monitoring options.Figure 2. Example - Sub-Module overview page 'Application Server'
Sub-Module Detail Page
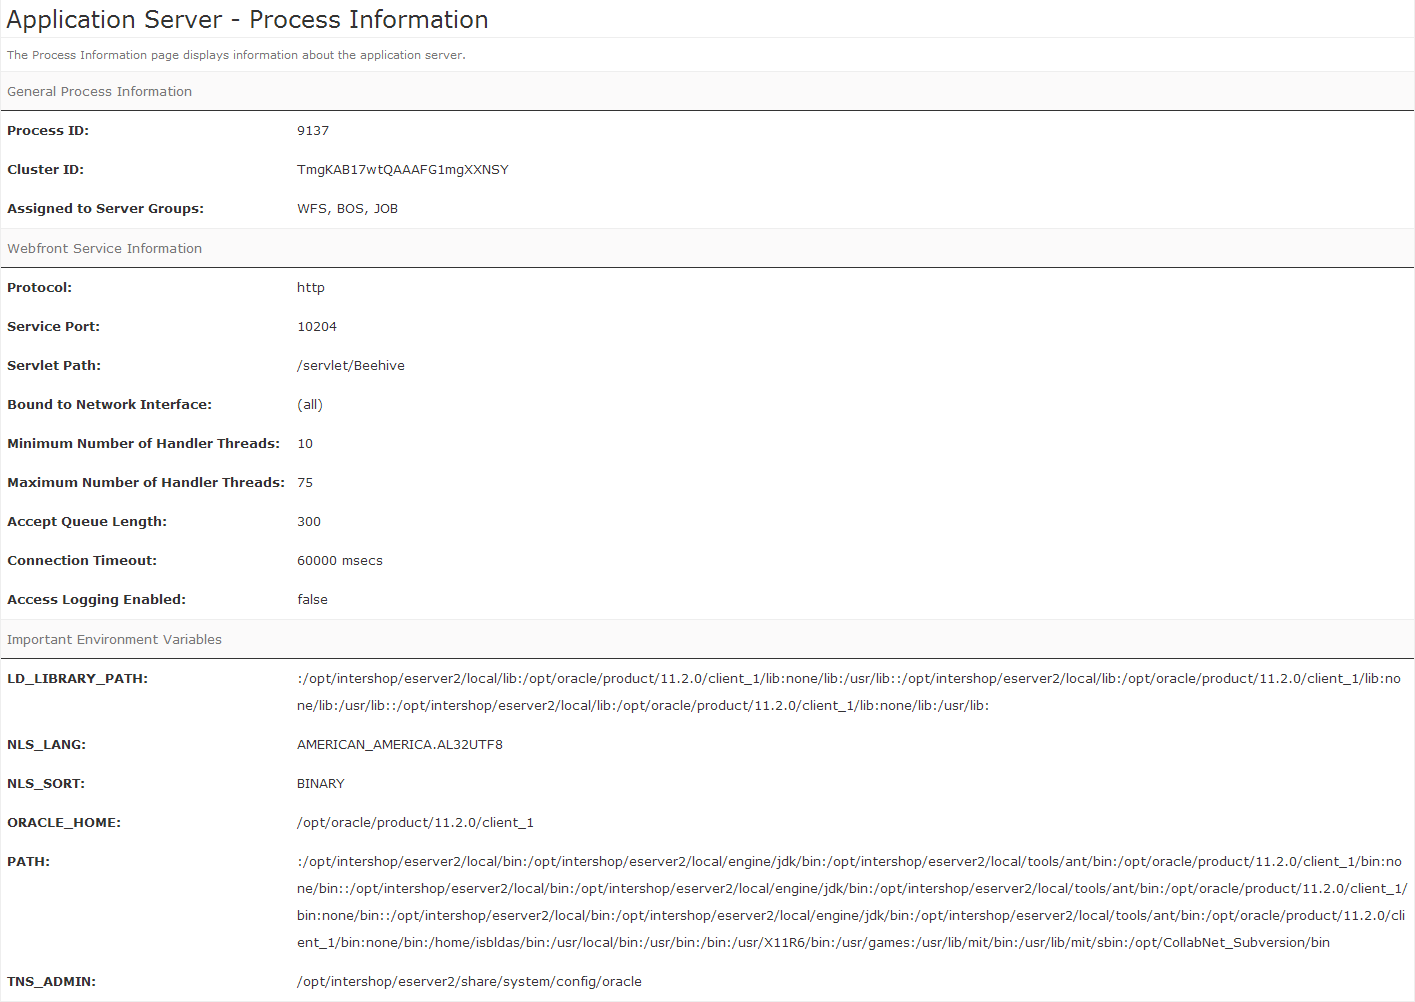
To view the detailed information of a topic listed in the sub-module overview page, click the corresponding link, e.g., Application Server. This opens the detail view.Figure 3. Example - Sub-module detail page - 'Application Server - Process Information'